

ADDaDOT™
helio planet
ADDaDOT™
a global initiative to eradicate harmful waste from our PLANET
each dot we add on the map represents a new HRU installation
each HRU is another '...nature's little helper'
'another DOT...another HRU...less waste on our planet'
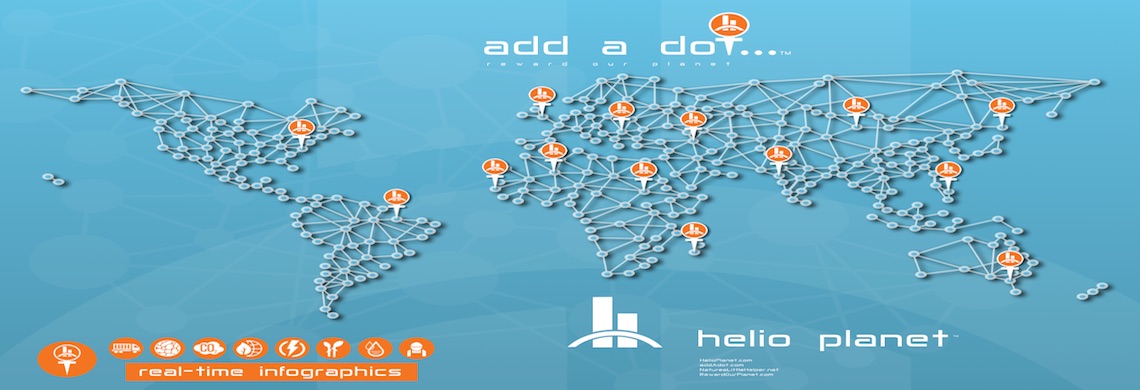
'another dot...another HRU...less waste'
Real-Time Infographics (test data shown)
transportables
The ADDaDOT™ 'transportables' data is the number of HRUs that are currently in service around the planet.
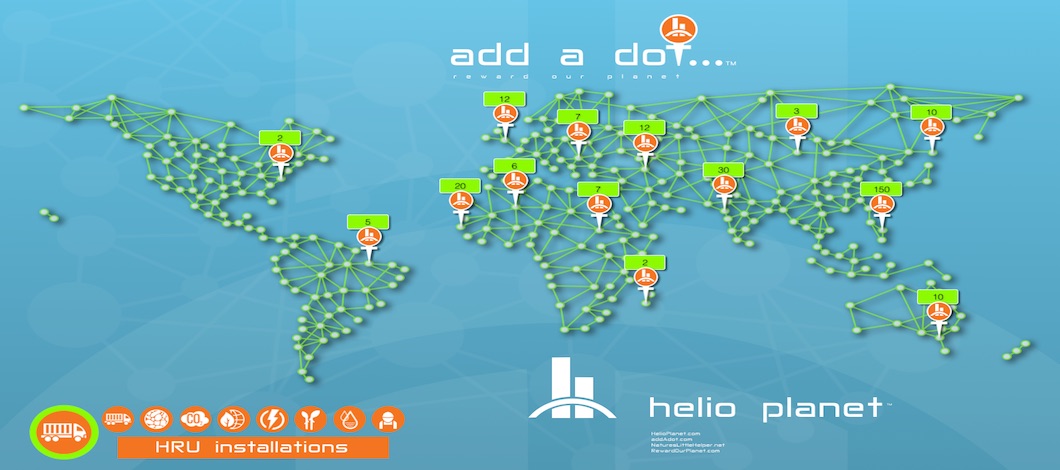
details for 'transportables'
Bio-Char
The ADDaDOT™ 'Bio-Char' data is the Tonne Per Day (TPD) of Bio-Char that is produced from each HRU.
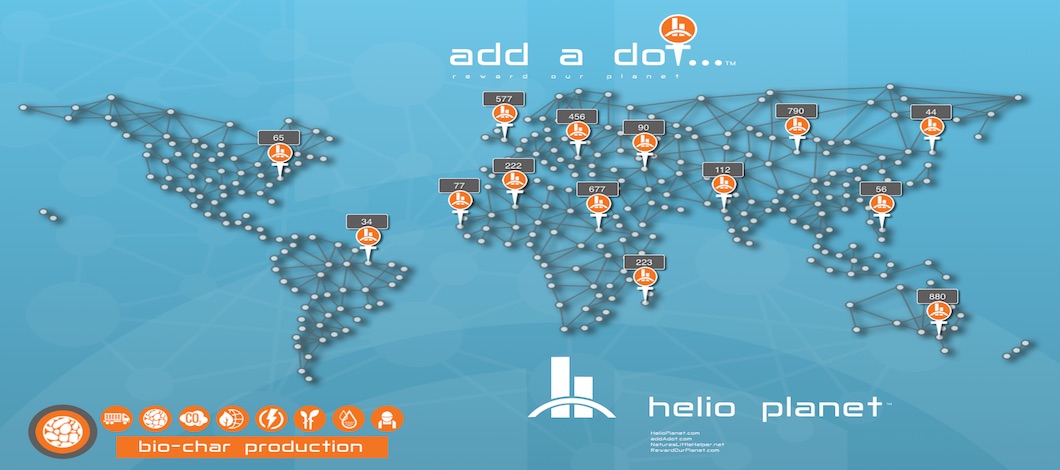
details for 'Bio-Char'
emissions
The ADDaDOT™ 'emissions' data is the sequestered Tonne of CO2 Per Day (TPD) that is NOT released into the atmosphere.
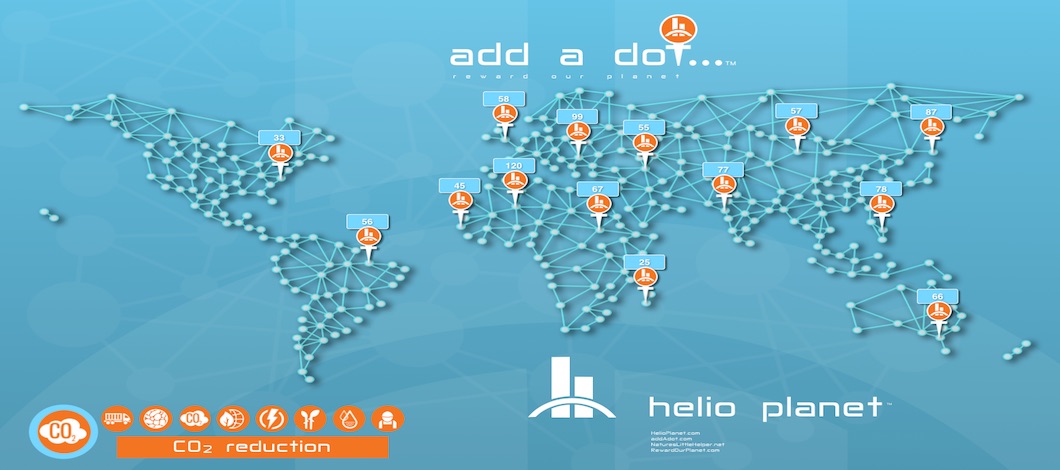
details for 'emissions'
biodiversity
The ADDaDOT™ 'biodiversity' data is the % of local biodiversification in proximity to the HRU.
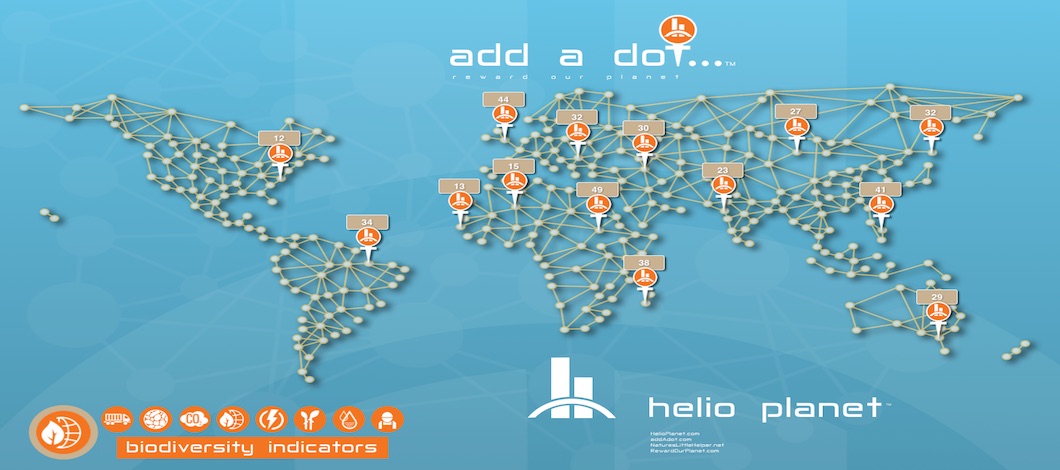
details for 'biodiversity'
energy
The ADDaDOT™ 'energy' data is the kilowatts (kW) of daily electricity generated from each HRU.
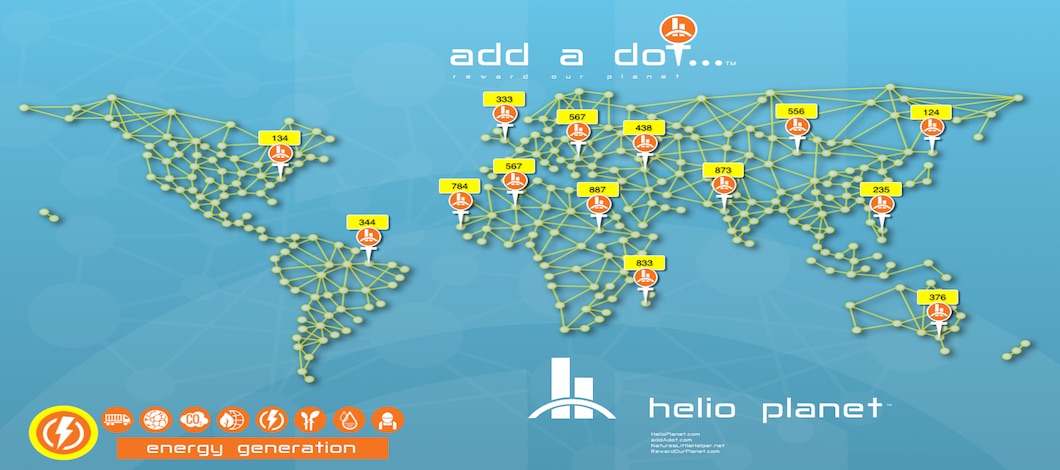
details for 'energy'
crops
The ADDaDOT™ 'crops' data is the Tonne Per Day (TPD) of crop output using Bio-Char based sequestration and fertiliser.
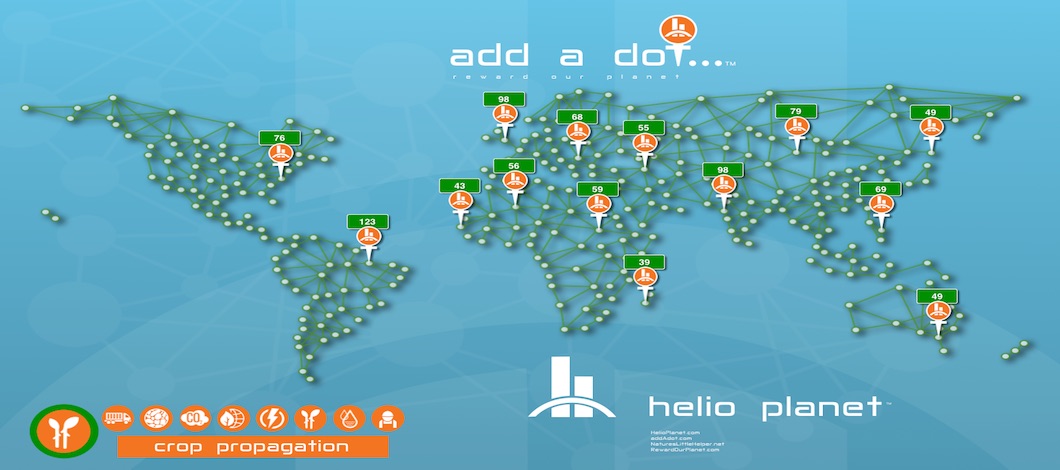
details for 'crops'
water
The ADDaDOT™ 'water' data is the Litres Per Day (in kLitres) that is recovered by each HRU.
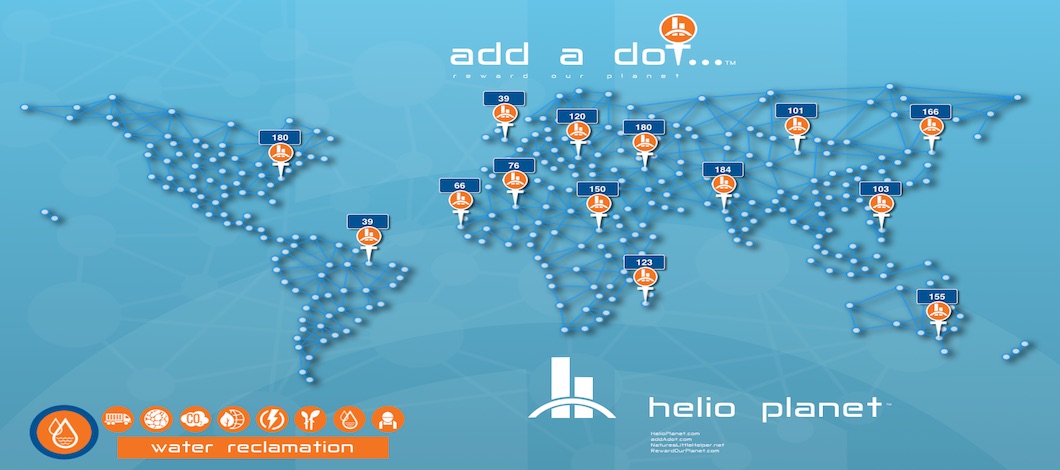
details for 'water'
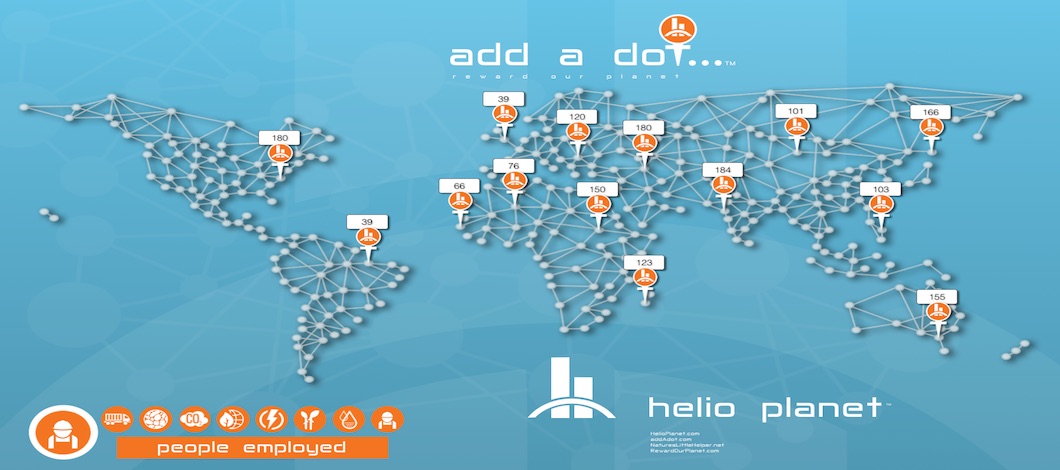
people
The ADDaDOT™ 'people' data is the number of people employed to operate each HRU around the planet.
details for 'people'
globally
every day...every transportable unit...
transportable
tonne of biochar
thousand lt. of water
thousand population coverage
Real-Time Helio Reactor Unit (HRU) Dashboard
(work in progress - demo only)
on-site resources
'data 1' is an example of the onsite total resources, used resources and the balance of resources available for the operation of the HRU%
total
resources
%
used
resources
%
available
resources
waste input
'data 3' represents the volume of waste input feedstock per HRU- biomass
- MSW
- sludge
- other
process data
'data 4' represents the sensor status within each HRU- sensor 1
- sensor 2
- sensor 3
- sensor 4
counters
'data 5' represents the number of occurrences of the specified activity from each HRUTonnes input
hours operating today
Tonnes output
commodity output
'data 6' represents the commodity output produced by each HRU- Bio-Char
- Bio-Gas
- Bio-Oil
- electricity
energy generation
'data 7' represents the volume of waste input feedstock per HRU- Bio-Gas Turbines
- Bio-Oil Turbines
- Bio-char Turbines
- Steam Turbines
- ORC Systems
revenues
'data 8' represents the total revenue derived from each HRU- Bio-Char
- Bio-Gas
- Bio-Oil
- electricity