Biodiversity
ADDaDOT™
Biodiversity
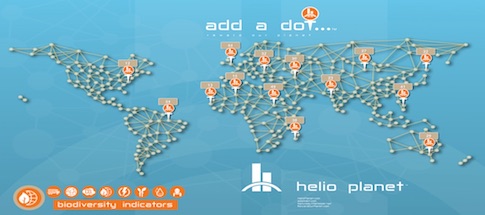
The infographics provide a graphical representation of the huge amount of data that is collected, every 30 minutes, from every Helio Reactor Unit (HRU) on the planet. The data is collated, interpreted and presented in real-time for viewing.
The ADDaDOT™ 'biodiversity' data represents the % of local biodiversification, in proximity to the HRU, that has beneficial results.
back to ADDaDOT™

